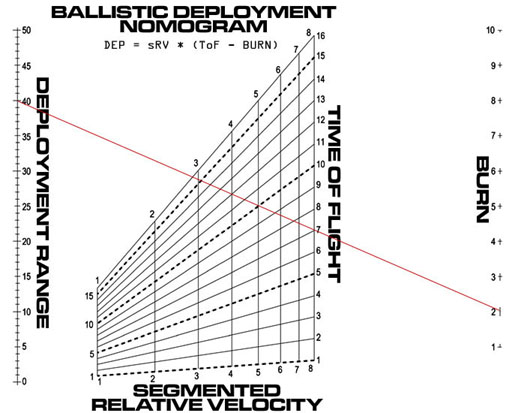
Most simple nomograms only handle three variables. You can handle more with a compound nomogram, but in certain cases one can use the more elegant Grid nomogram. These replace one or more of the linear scales with a grid. Each grid codes two variables. The following is a grid nomogram:
It handles four variables. In theory, one could have a six variable nomogram, with three side-by-side grids, but I've never seen one.
The basic idea is to reduce the equation to such a state where one can insert two variables into a line on the determinant, instead of the customary one. This can only be done with certain equations.
The equation for this grid nomogram is R = SRV * ( TOF - B ). After wrestling with it for a while, I managed to cram variables SRV and TOF into the second row:
|
= 0 |
Ordinarily, the way to draw a scale coded by a row in the determinant is to vary the value of variable, and use that value to calculate the x and y coords of that point. Draw a line between the points to draw the scale.
To draw a grid is a bit more complicated, since there are two variables in the determinant row instead of one. So what you do is set the first variable (SRV) to a given constant value (1), vary the second variable (TOF) (from 1 to 16), and draw a scale line. Then alter the value of the first variable to a different value (2), and repeat. This will give you a series of vertical lines.
Now make the second variable (TOF) constant (1) and vary the first variable (SRV) (from 1 to 8). Repeat until you get a series of horizontal lines. The horizontal and vertical lines create the grid.
For a more in-depth explanation of grid nomograms, I refer you to The Nomogram: The Theory And Practical Construction Of Computational Charts, 3rd ed. by H.J. Allcock and J.R. Jones, (London: Sir Isaac Pitman and Sons, Ltd.) 1946, pages 139 to 147 and pages 161 to 164.