A Determinant is an operation on a square mathematical matrix. There are entire college courses on matrices and determinants (especially since they are powerful tools for 3-D computer graphics). But all you need to know are two things: [a] how to use a determinant to draw a nomogram and [b] how to turn an equation into a determinant.
This page will just cover drawing a nomogram from a determinant.
Here is a skeleton of a three variable determinant:
    |                |
    | X(a)  Y(a)  1  |
    |                |
    | X(b)  Y(b)  1  | = 0
    |                |
    | X(c)  Y(c)  1  |
    |                |
X( ) and Y( ) are functions, which in this case means its a fancy way of saying an equation with one variable. The variable is the one inside the parenthesis. X(a) and X(b) are totally different equations. For instance, X(a) might be a^2/(a-1) and X(b) might be -b.
Here is an actual real live determinant:
|
= 0 |
It solves the quadratic equation az2 + bz - ab = 0 (as if you care) and has functional moduli that will fit it within 16 inches by 16 inches, a = +-20 and b = +- 25.
How do we draw it?
First we just look at the important part of the determinant:
| X coord equation |
Y coord equation |
|
| a scale | -0.4 * a | 0 |
| z scale | -0.42 * z | 0.32 * (z^2) |
| b scale | 0 | 0.32 * b |
As you can see, the top row plots the a scale, the middle one the z scale and the bottom one the b scale. Each scale has two equations, one will calculate the X coordinate and the other the Y coordinate for a given value of the variable.
These two coordinates are used to plot a point for that value. Plotting is done with the Cartesian coordinate system.
Lets do an example to make things clear. We will plot the Z scale.
First make a table of X,Y values for the Z scale. You can do this by hand, but it is much easier to use a spreadsheet. Here is a sparse table for the Z scale:
| Z values | X coord (-0.42 * z) | Y coord (0.32 * (z^2)) |
| -5 | 2.0 | 8.0 |
| -4 | 1.6 | 5.1 |
| -3 | 1.2 | 2.9 |
| -2 | 0.8 | 1.3 |
| -1 | 0.4 | 0.3 |
| 0 | 0.0 | 0.0 |
| 1 | -0.4 | 0.3 |
| 2 | -0.8 | 1.3 |
| 3 | -1.2 | 2.9 |
| 4 | -1.6 | 5.1 |
| 5 | -2.0 | 8.0 |
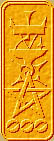
Here is the Z scale plotted on Cartesian coordinates:
The entire nomogram looks like this: