The simplest nomogram doesn't even need a straight-edge in order to read it. If the equation only has two variables, the nomogram only needs a single line. This is called an Adjacent scale, Conversion scale, Double-sided scale, or Nomogram of the Second Class. (a nomogram with one variable would be a fixed gauge)
Such nomograms are used for an formula in the form of f(a) = f(b), where the two "f( )" are "functions" (which in this context means "equation", more or less) and the two variables are "a" and "b".
For example, if one wants to convert temperature from Celsius to Fahrenheit, the equation is:
C = 5/9 * ( F - 32 )
where f(a) would be C = x, f(b) would be 5/9 * ( F - 32 ) = x, a would be C and b would be F.
(Note to non-computer programmers: "*" is the symbol for multiplication.)
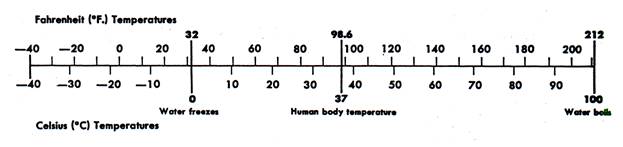
It can be represented by the following nomogram:
Just by inspection you can see that 60° F is about 16° C, no straight-edge is required.
How do you draw it? I'm going to explain the manual method here. Later I'll tell you how to make the computer do the work for you.
First draw the line. Mark the zero point, called the "origin". The scales on each side of the line will share the same origin. (Note that in some nomograms the origin will be off the edge of the scale)
Next decide upon the size factor. The technical term for this is "Functional Modulus", usually abbreviated as "μ". Just decide how long you want the line to be (i.e., small enough to fit on the paper), and divide that by the number of x values it has to have. More specifically, subtract the maximum value from the minimum value to determine the number of values.
Example: the Fahrenheit scale will have a maximum 210 degrees and a minimum -40 degrees. The formula for Fahrenheit is 5/9 * ( F - 32 ) = x. So 5/9 * ( 210 - 32 ) = 99 (round up to 100) and 5/9 * ( -40 - 32 ) = -40.
100 - (-40) = 140 x values
If we take the easy way, we will decide we want the scale to be 14 centimeters long (140 millimeters). This will result in a functional modulus of (μ):
140 millimeters / 140 values = one millimeter per x unit
If you don't take the easy way, you will make the scale some other length, say 24 centimeters (240 millimeters). This would make the functional modulus about 1.71 millimeters per x unit.
More mathematically, the functional modulus is:
μ = L / ( f(a2) - f(a1) )
where L is the desired length of the scale, f(a2) is the maximum desired value and f(a1) is the minimum desired value.
Both scales have to use the same functional modulus. This is only true of Adjacent scale nomograms, in other nomograms there are several functional moduli.
On each side of the scale will be a set of tick marks. Each set will be drawn by one of the two functions.
Remember, the equation f(a) = f(b) is split into two functions f(a) = x and f(b) = x, one for each side of the scale. Splitting our equation C = 5/9 * ( F - 32 ) in two and adding the functional modulus gives us our Celsius function and the Fahrenheit function. The Celsius scale uses the function μ * C = x while The Fahrenheit scale uses the function μ * (5/9 * ( F - 32 )) = x.
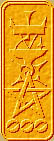
Refer to the diagram below. The lower half is the Celsius section. The green scale represents a metric ruler. The ruler is set so that the zero mark on the ruler lines up with the origin.
The first tick mark is at 10 degrees Celsius. The function is C = x so the value is 10. Ten times μ equals ten millimeters. Measure to the ten millimeter mark from the origin and draw the tick mark.
The second tick is at 20 degrees, which comes to 20 millimeters. Repeat until all the tick marks are drawn.
Then pivot the ruler around the zero mark until it points left and drawn the negative degree marks.
Now for the hard part. The first Fahrenheit tick mark is at 40. The function is 5/9 * ( F - 32 ) = x so the value is 4. Four times μ equals four millimeters. Measure to the four millimeter mark from the origin and draw the tick mark, labeling it with "40". You can see this in the upper section of the diagram.
The second tick is at 50 degrees, which comes to 10 millimeters. Repeat until all the tick marks are drawn. Then pivot the ruler around the zero mark until it points left and drawn the negative degree marks.
A spread sheet makes this much easier.
| variable Fahrenheit | function 5/9 * ( F - 32 ) | μ * function (μ=1) |
| -40 | -40 | -40 |
| -30 | -34 | -34 |
| -20 | -29 | -29 |
| -10 | -23 | -23 |
| 0 | -18 | -18 |
| 10 | -12 | -12 |
| 20 | -7 | -7 |
| 30 | -1 | -1 |
| 40 | 4 | 4 |
| 50 | 10 | 10 |
| 60 | 16 | 16 |
| 70 | 21 | 21 |
| 80 | 27 | 27 |
| 90 | 32 | 32 |
| 100 | 38 | 38 |
| 110 | 43 | 43 |
| 120 | 49 | 49 |
| 130 | 54 | 54 |
| 140 | 60 | 60 |
| 150 | 66 | 66 |
| 160 | 71 | 71 |
| 170 | 77 | 77 |
| 180 | 82 | 82 |
| 190 | 88 | 88 |
| 200 | 93 | 93 |
| 210 | 99 | 99 |
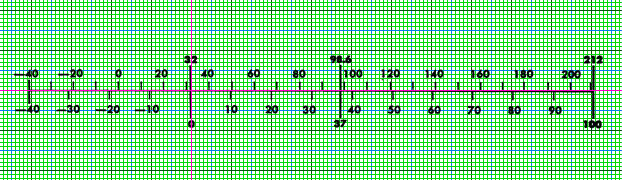
Instead of using a ruler, one can draw it on graph paper. The vertical hot pink line is the origin.
For a good appearance, follow the following style rules: